
Strategy management software that opens on the strategy house
The program dashboard in Centric Governance Central (CGC) shows the whole program on one page: the target, what is identified, what is risk adjusted, what is realized, and what needs a decision this week.
Featured by MicrosoftOn Microsoft MarketplaceMicrosoft Solutions Partner
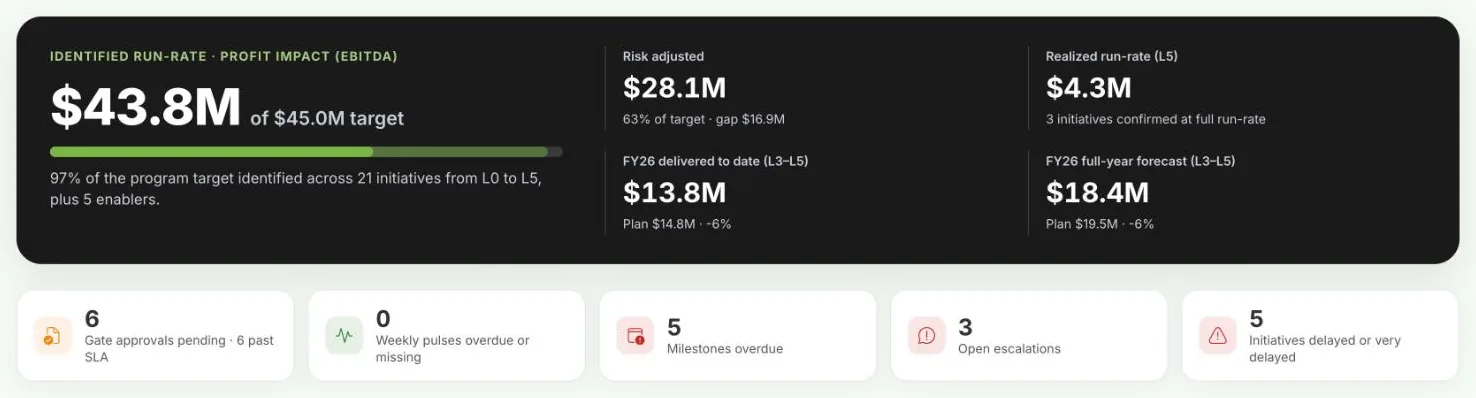
What does the CGC program dashboard show?
It shows identified, risk adjusted and realized value against the program target, value by gate and by workstream, in year value against plan, enterprise KPIs, key initiatives, overdue milestones and the decisions waiting on leaders. Each figure opens the list behind it.
The strategy house, as the front door In build
The home view is the strategy itself. The roof is the program and its target. Each pillar is a value workstream, with its share of the target and one core KPI. Enabler workstreams sit underneath as steps. Select any part to open its dashboard.
- Built from your hierarchy, never drawn by hand
- Pillar share is computed from the workstream targets
- A bar across the top lets you flip between dashboards
Diagram of the strategy house, with targets from the demo program.
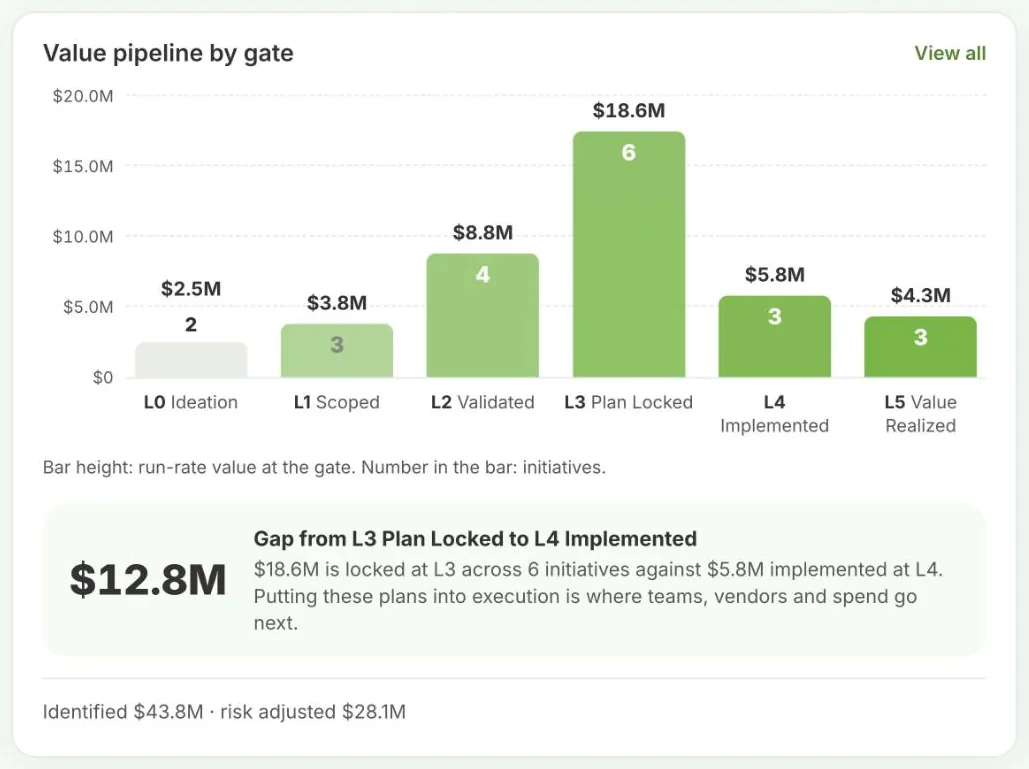
Value by gate, at a glance Live
Six gates from L0 Ideation to L5 Value realized, with the run rate value and the number of initiatives at each. The gap between what is locked at L3 and what is implemented at L4 is called out, because that is where teams, vendors and spend go next.
- Gate weights 0, 25, 50, 100, 100 and 100 percent
- Identified value counts L1 to L5
- The L0 hopper is shown, and never counted
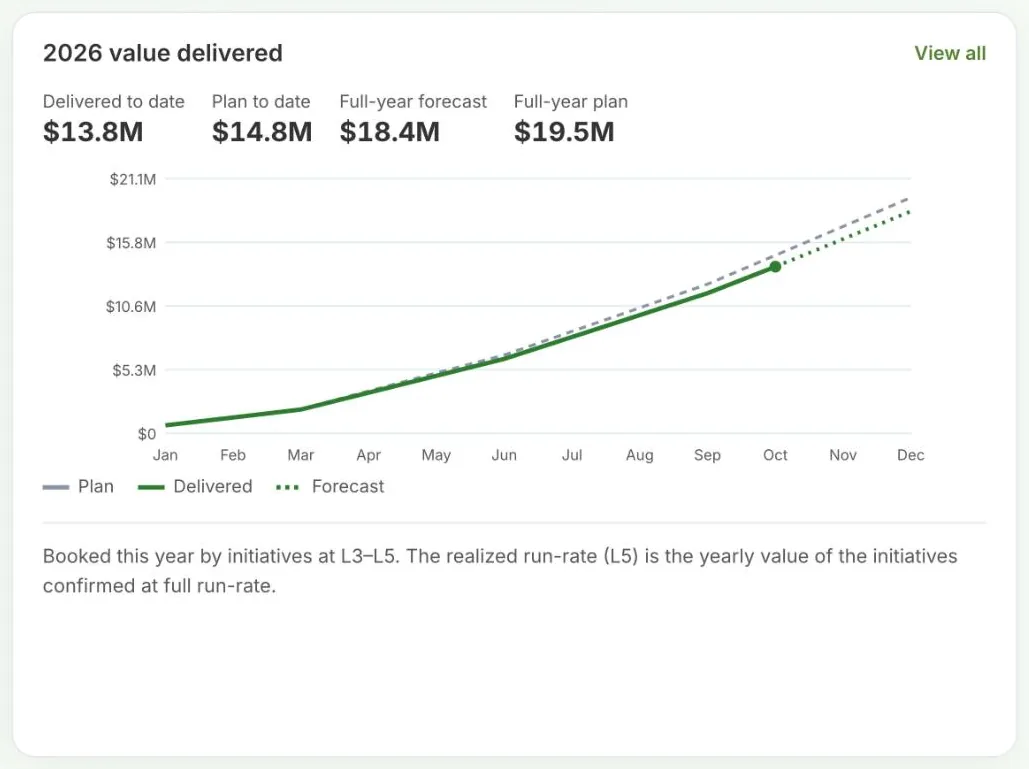
In year value against plan Live
Delivered to date, plan to date, the full year forecast and the full year plan, with the cumulative lines on one chart. Run rate tells you what the program will be worth. In year tells you what lands in this year's numbers.
- Plan from the L3 snapshot
- Delivered from monthly reported values
- Forecast from each owner's latest estimate
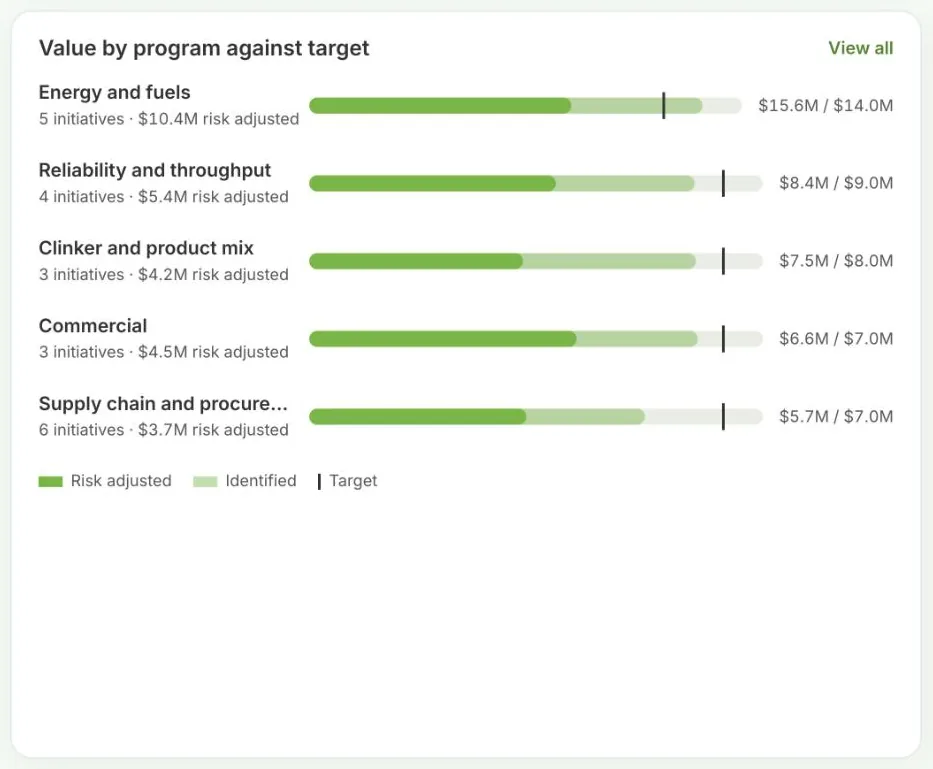
Every workstream against its target Live
Identified and risk adjusted value for each workstream, with a marker at its target. A sponsor sees at once whether the pipeline is big enough, and how much of it is still a promise.
- Risk adjusted and identified bars per workstream
- Initiative count beside each
- Opens the workstream dashboard
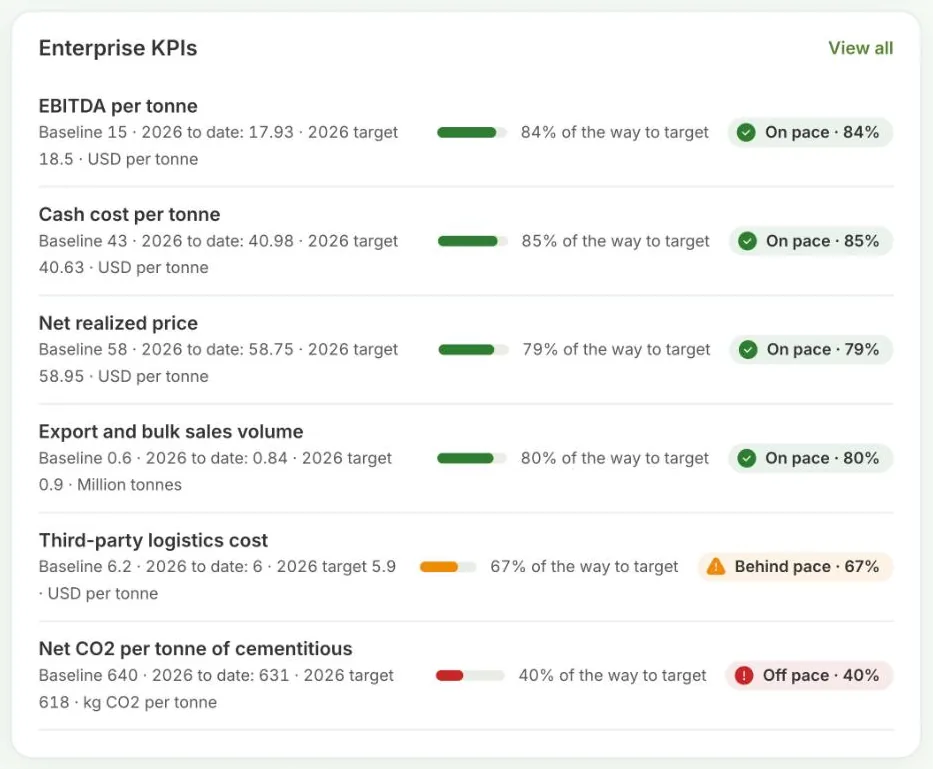
Enterprise KPIs, separate from the money Live
Five or six enterprise KPIs with baseline, year to date value, target and pace. Plant and function KPIs belong on each pillar's dashboard, so the program view stays readable.
- Pace against a straight line trajectory
- On pace, behind pace or off pace
- Never used to calculate financial figures
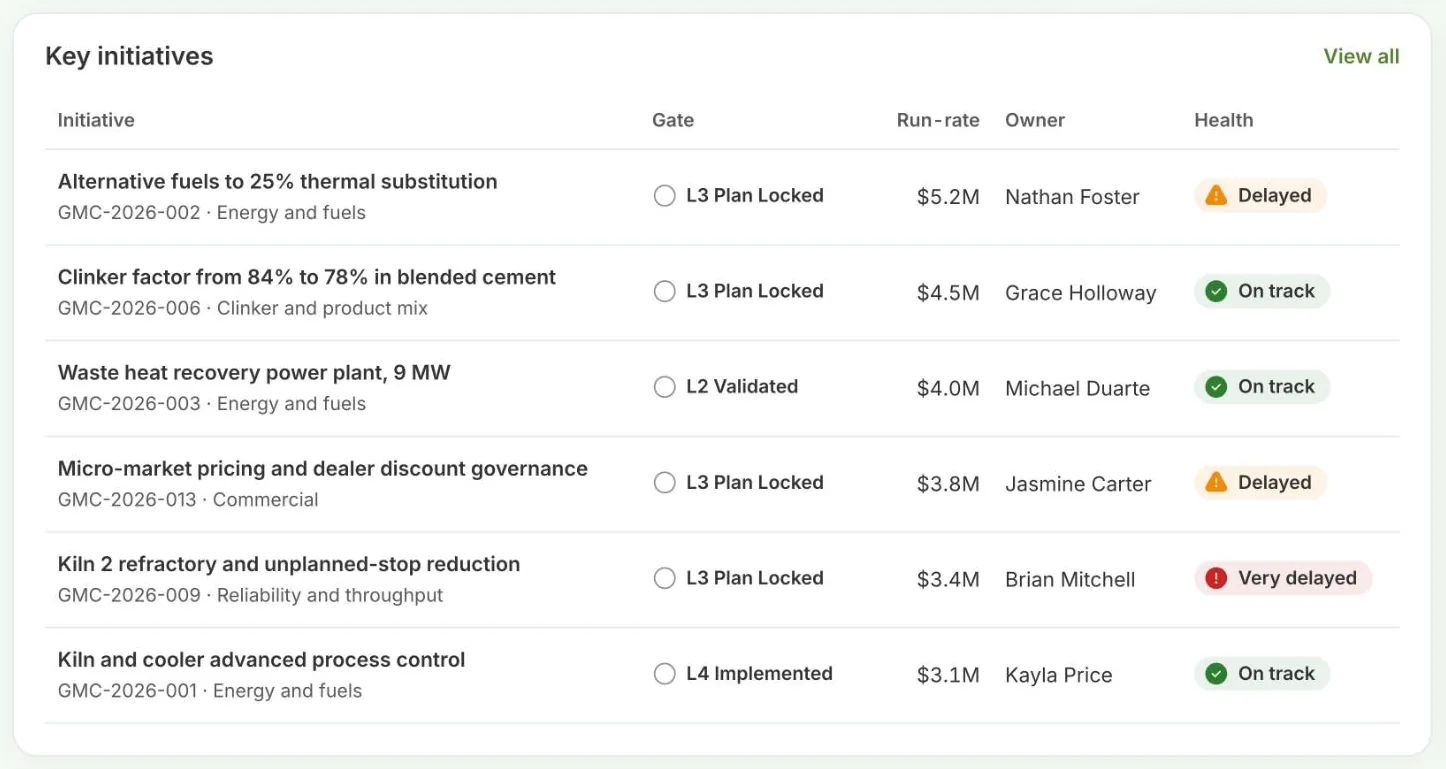
What needs attention this week Live
Key initiatives by run rate, with gate, owner and health, beside the decisions waiting on leaders: escalations raised in the weekly pulse and gate requests past their deadline.
- Top initiatives by run rate
- Escalations with the initiative and date
- Overdue milestones and the next 30 days
The page each meeting needs
| Meeting | The view | What it settles |
|---|---|---|
| Weekly workstream huddle | The workstream dashboard | What slipped, and who acts |
| Monday steering committee | The program dashboard and open escalations | Decisions, gate approvals, overdue items |
| Monthly value review | Value by gate, in year value, financial lines | Where the value stands against plan |
| Quarterly strategy review | The strategy house and enterprise KPIs | Whether the strategy is landing |
Export any dashboard or list to PDF or Excel Live Present mode for the steering committee In build
Questions
Do we need Power BI for the dashboards?
No. The dashboards are native to SharePoint and need no Power BI license.
Do the dashboards update on their own?
The dashboards read the same record your teams update. When an owner submits a pulse or a gate is approved, the next view reflects it.
Can each sponsor see only their workstream?
Yes. Select a pillar to open its dashboard, scoped to that workstream, with its own target, KPIs, milestones and decisions.
Can we print it for the board?
Yes. Export the dashboard or any list to PDF or Excel.
Do not take our word for it. Take Microsoft's.
CGC is listed and transactable on Microsoft Marketplace, co-sell ready with Microsoft, and the subject of a Microsoft partner success story. Centric is a Microsoft Solutions Partner for Data & AI (Azure).
Centric's enterprise-grade platform unifies strategic planning, KPI management, program execution, and governance workflows into a single, secure system of record.
- February 2026Listed on Microsoft MarketplaceCGC goes live on Microsoft Marketplace as a transactable offer.
- May 2026Named in the Microsoft Marketplace blogMicrosoft features CGC among new transactable offers on 26 May 2026.
- October 2026Co-sell ready with MicrosoftMicrosoft sellers can work with Centric on customer purchases.
- November 2026Featured in a Microsoft partner success storyMicrosoft publishes how Centric built CGC into a scalable Marketplace offer, on 13 November 2026.
See it on your own sector's data.
A 30 minute walkthrough, built around a program like yours. No slides, the real product.