
Benefits realization you can defend, line by line
Centric Governance Central (CGC) keeps a forecast apart from a banked saving. Every initiative's value is estimated in one profit metric, phased by month, reviewed by finance, and counted only as far as its gate allows.
Featured by MicrosoftOn Microsoft MarketplaceMicrosoft Solutions Partner
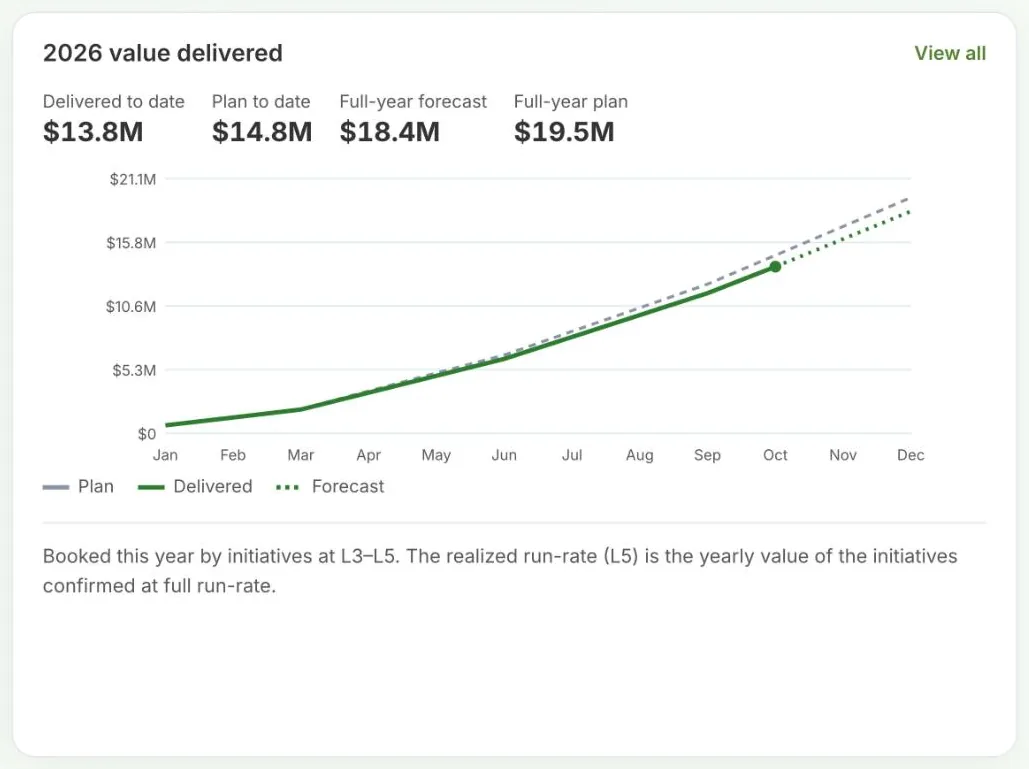
What is benefits realization?
Benefits realization is the work of making sure the value an initiative promised actually arrives, and proving it. In CGC it ends at gate L5, when the run rate has held at plan for three months and the finance partner has confirmed it.
One profit metric for the whole program Live
Choose EBITDA, operating profit, gross profit or profit after tax once, at program level. Every initiative estimates and rolls up in that metric, and every screen labels it.
- One currency and one unit across the program
- Changing the metric is an administrator action and is flagged
- Management estimates, not ledger figures
of organizations fully captured the value targeted by their highest priority cost initiative last year.
Source: Deloitte, 2026 Enterprise Cost Transformation SurveyRun rate and in year, kept apart Live
Run rate is the annual value once an initiative is fully live. In year is the share that lands in this fiscal year. CGC shows both, so the program target and this year's budget are never confused.
- Example: $12.0M a year, live from October, is $3.0M in year one
- One off costs are netted from in year value
- CAPEX is shown as a memo, outside profit impact
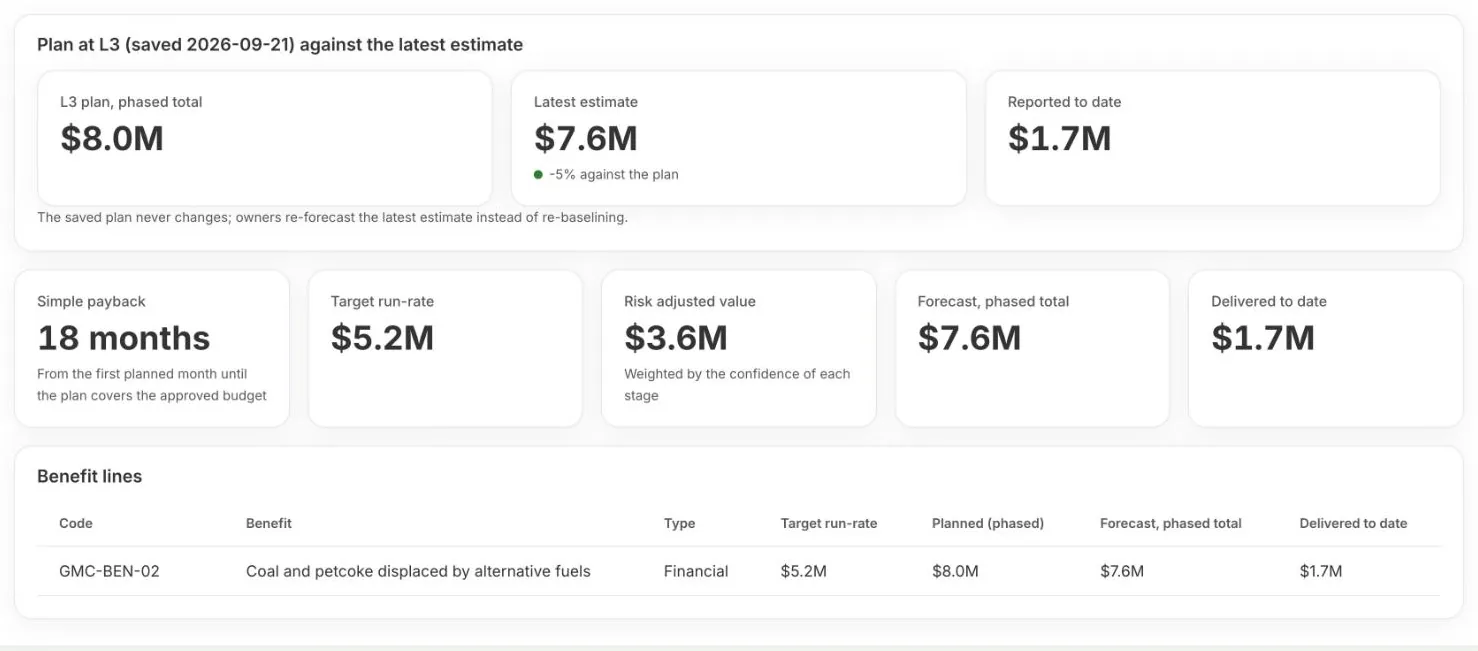
The plan, the latest estimate, and what was reported Live
At L3 the plan is saved and cannot be edited. Owners keep the latest estimate current and enter reported values monthly. The finance partner marks each period reasonable or queried.
- Latest estimate below plan by more than 10% turns Amber, by more than 25% turns Red
- Every change to the estimate carries a comment
- Benefit lines with target, plan, forecast and realized Live
Where the value lands on the P&L In build
Each impact line is tagged to the P&L line it changes, such as revenue from price and mix, fuel and power in cost of goods sold, or freight. CAPEX is tagged to plant and equipment as a memo. The program view breaks the total down by line.
- A roll up of initiative estimates only
- No ledger feed, no depreciation, tax or cash flow modelling
- Operating KPIs never feed a financial line
| Line | $M run rate |
|---|---|
| Revenue: price and mix | 5.0 |
| Revenue: volume | 7.2 |
| COGS: fuel and power | 15.7 |
| COGS: raw materials and clinker | 7.5 |
| COGS: maintenance, stores and packing | 2.9 |
| Distribution and freight | 2.4 |
| SG&A | 0.6 |
| Identified run rate | 41.3 |
| Memo: CAPEX to plant and equipment | 26.4 |
Illustration from the CGC demo program for a fictional cement producer.
What it means for your role
Pick your role to see what changes for you.
Choose a role above. Every role sees the same record, with the view and the decisions that matter to them.
For CEOs and executive sponsors
One number the board can trust
Identified, risk adjusted and realized value against the program target, with the gap in plain sight. Only value your finance partners have confirmed counts as realized.
Decisions, not slides
Escalations from the weekly pulse and gate requests waiting on an approver land on one list. You clear them in the meeting, on the data in front of you.
Value that stays
L5 means the run rate held for three months and finance confirmed it. You see what is real today, apart from what is still a promise.
For CFOs and finance leaders
Finance signs the gates that matter
The finance partner approves at L2 Validated, L3 Plan locked and L5 Value realized. Nothing reaches realized value without them.
Plan, latest estimate and reported, side by side
The plan is saved at L3 and cannot be edited. Owners keep the latest estimate current, and a drop of more than 10% turns the initiative Amber.
Value mapped to the lines it changes In build
Impact lines carry the P&L line they land on, with CAPEX shown as a memo against plant and equipment. These are management estimates, kept apart from the ledger.
For chief transformation officers
A pipeline with real weights
Value at L1 counts 25%, at L2 50%, and from L3 the full amount. The risk adjusted total and the gap to target update as gates are passed.
Gates with named approvers and deadlines
Every listed approver must sign. Approvals have a 48 or 72 hour SLA, and anything past it shows on the dashboard.
A steering committee without slides
Overdue milestones, missing pulses, open escalations and gate requests are counted on the dashboard and open as filtered lists.
For procurement leaders
Savings that survive to the P&L
Each sourcing initiative moves from L0 to L5. L5 needs the run rate held for three months and the finance partner's confirmation, so a signed contract is not mistaken for a banked saving.
A shorter vendor review
CGC installs into your own Microsoft 365 tenant and stores its data in your SharePoint. Centric does not host your data, which leaves less for third party risk review to cover.
Licensing that does not grow with adoption
Licensed by module with unlimited users, and listed on Microsoft Marketplace, a marketplace your procurement team already knows.
Questions
Who confirms that a benefit is real?
The finance partner. L5 Value realized needs the run rate held at plan for three months and the finance partner's approval, with the workstream sponsor.
Can we track benefits that are not financial?
Yes. Track them as KPIs on the initiative. Enablers carry no profit estimate at all, and are governed by milestones and KPIs.
What happens to the value if an initiative is canceled?
Its value leaves the pipeline, and the history of its estimates and gate decisions stays on record.
Is this an accounting system?
No. CGC holds management estimates entered by owners and reviewed by finance. It is not posted to, or reconciled with, the general ledger.
Do not take our word for it. Take Microsoft's.
CGC is listed and transactable on Microsoft Marketplace, co-sell ready with Microsoft, and the subject of a Microsoft partner success story. Centric is a Microsoft Solutions Partner for Data & AI (Azure).
Centric's enterprise-grade platform unifies strategic planning, KPI management, program execution, and governance workflows into a single, secure system of record.
- February 2026Listed on Microsoft MarketplaceCGC goes live on Microsoft Marketplace as a transactable offer.
- May 2026Named in the Microsoft Marketplace blogMicrosoft features CGC among new transactable offers on 26 May 2026.
- October 2026Co-sell ready with MicrosoftMicrosoft sellers can work with Centric on customer purchases.
- November 2026Featured in a Microsoft partner success storyMicrosoft publishes how Centric built CGC into a scalable Marketplace offer, on 13 November 2026.
See it on your own sector's data.
A 30 minute walkthrough, built around a program like yours. No slides, the real product.